I was recently at NIPS, a week long conference on machine learning. With over 8000 attendees, a new record for the event, it is one of the biggest conferences dedicated to machine learning. In the coming weeks, I’m looking forward to writing about the various subjects discussed at the event, including my general takeaways. In this article, I am going to focus mainly on the time series workshop day at NIPS, which came at the end of the conference, blending it with a few of my own thoughts.
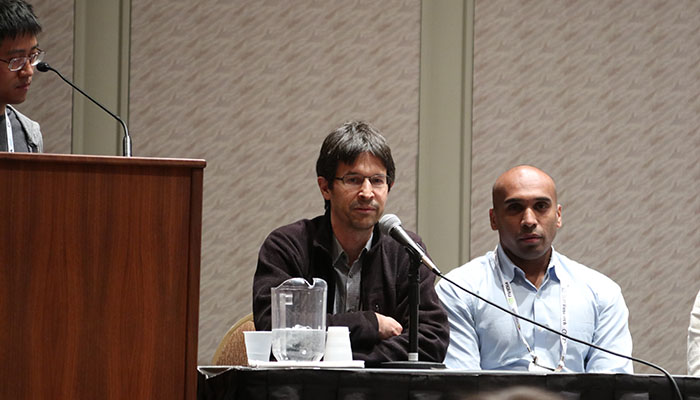
Time series can be found in many different domains, ranging from weather to traffic to medicine. Essentially any measurement where we repeatedly record a specific value at different times, can constitute a time series. The observations have an order. Many problems in finance involve time series and their prediction. However, there can often be complications analysing time series. The panel at the workshop (partially pictured above) discussed some of the issues which can be involved. The speakers in the panel were Matthias Seeger (Amazon), Firdaus Janoos (Two Sigma), Claire Monteloni (GWU) and Karthik Sridharan (Cornell), with Scott Yang (Courant) moderating. The opening question discussed what the most important problems were in time series. Claire suggested that understanding climate change, was one area, as well as trying to predict financial crashes and also dealing with personal medical analysis (such as data collected from Fitbits). Firdaus noted that there were many divergences between theory and practice. Time series are not always stationary and not i.i.d. (independent and identically distributed random variables), yet many machine learning techniques assume this. Indeed, this is what makes finance a tricky area, given the non-stationary of financial time series. Later Firdaus gave a good example of this, noting that we cannot for example use 2008 financial data to model 2017. The environment is very different. If anything older data, for example 2002, might display more similarity to 2017.
The subject of “cool tricks” to deal with time series also came up. Matthias made the point that often simple techniques work. It was important not to forget about ideas such as seasonality modelling. Firdaus echoed these words, adding that there is no substitute for good data, it’s not possible to “machine learn” yourself out of poor quality data. Feature engineering still works. This is something that I’ve found, having a good handle on what features (or variables in classical statistical terminology) are important can be the crucial step, when it comes to modelling financial markets. Another tip, from Claire, was to use a multi-task learning, to forecast at multiple time horizons (eg. one week, two week and 1 month ahead etc.), as opposed to attempting to forecast only a single time point.
Perhaps unsurprisingly, deep learning came up as an audience question. In his answer, Firdaus said it can often be good to start simple, and within finance the time series data tends to be noisy. It can often be the case that we just want to improve a forecast slightly. I can’t remember ever having a 100% success rate in a trading strategy (I doubt anyone does!), however, for trading, we just need to be right *most* of the time, or have a favourable skew in our returns to monetise it. Having such a low accuracy rate would unlikely be acceptable in other domains. A point both he and Matthias made, was that deep learning needs a lot of data. Matthias said if we have many time series this can be done (as they do have at Amazon), but deep learning should be avoided without large quantities of data. In a finance sphere, one area could be in high frequency trading, where there are vast quantities there, although the computational challenges are likely to be great, given the need for fast execution (Matthew Dixon has done work on applying deep learning to order book data). Many of the challenges when dealing with time series data are not purely technical.
Claire suggested that many problems can be solved through an interdisciplinary approach and for experts on machine learning to work with domain experts. I have to agree with this notion, especially in finance. Having an understanding of how markets works is really crucial, and can help you avoid problems when doing any sort of statistical analysis, in particular and appreciation for how liquidity limits how you can transact is important. There is little point having a very accurate prediction which cannot be monetised, given lack of liquidity. Not having domain expertise results in a lot of unnecessary time wasted on “solutions” which would not work in practice. A point I have made in the past is that machine learning can be applied to different stages of a trading strategy, whether it’s cleaning datasets or in classification, rather than purely at the layer of creating a buy or sell signal. This point was made by Firdaus, noting that whichever layer the “machine” solved, it enabled humans to focus on the harder elements. Karthik suggested that each layer of the automation is a learning problem in itself, and was dependent on how much data you had.
Traffic analysis provides a rich data source for time series analysis. In his presentation, Yaguang Li (USC) described the problems associated with traffic congestion. He began by noting that assessing the best current route was not the same as forecasting the fastest route for the period ahead. The problem was especially key when it comes to self-driving cars. The challenge is that it is both a problem in space and time dimensions. The input variables can be considered to be both the road network, as well as past traffic flow. The road network can be modelled as a directed graph, which is updated at each time point. He presented several deep learning approaches including combining a diffusion convolution of filter with a recurrent neural network (DCRNN). The technique improved upon simpler methods, such as using seasonality patterns or ARIMA models for modelling traffic. His example dataset included Los Angeles and San Francisco (GitHub code here).
Kaggle is a popular data science website, which regularly runs data orientated competitions. Vitaly Kuznetsev (Google) discussed a Kaggle competition where participants were asked to forecast hits on 145,000 Wikipedia pages. Participants were provided with a dataset consisting of historical web traffic data related to Wikipedia, over the past 1.5-2 years, which could be used to develop their prediction algorithms. Vitaly gave several examples of the data. In some cases it was at least possible to interpret the data qualitatively, eg. hits on Wikipedia pages for the Beatles. However, on many pages there were very few hits, and it was difficult to discern any such patterns by eye. The participants algorithms were then run in a live competition setting as a test for a few weeks, with the best winner selected as having the lowest error between the prediction and actual traffic. He then described the techniques employed by the top 8 entries. One feature which was common through most of them was the use of an ensemble of several different techniques. Not every top participant used more complicated machine learning approaches. Even for those that did, there was still some careful thought around the features and usually involved normalising the features and taking into account various obvious seasonalities in the dataset and other factors such as whether viewers were on mobile or not. Just using out-of-the-box machine learning software, did not yield top results, and required substantial tweaking. You can explore the problem and datasets further on Kaggle.
As mentioned earlier time series are ordered. Can we gauge an order from what appear to be unordered elements, in other words can we recover the order? Yao-Hung Hubert Tsai (Carnegie Mellon) talked about this in his presentation entitled “Discovering order in unordered datasets: Generative Markov Networks”. Photos of the same person may appear i.i.d. but if they are of the same person in motion, may not be i.i.d. (frames would have to be in the correct order to capture our motion). Hence, if we give the example of photos, is it possible to order them by similarity? Traditional techniques to discover the order typically result in an intractable problem of the order n! Hence he suggested using a neural network to speed up the computation. He showed an example trained on a dataset of horse images from the MNIST, when ordered by similarity, showed horses in similar motion. One possible area in finance, where such a technique could be used in finance to try to identify time periods of “similar” price action. Admittedly, I’m not a fan of overlay plots like this. However, I think it could be an interesting way to do help fundamental researchers to do event studies. Often forecasts can be based on the discrepancy between different time series. Mathieu Blondel presented on soft-DTW, a differential loss for time series, which addressed this subject. He gave a motivating example, where we might be forecasting pollution levels. Once the ground truth is revealed we can updated forecast, based upon our loss function. The loss function needs to be differentiable. Also what if we have different lengths in our respective time series. He presented a loss function called soft-DTW which could be used in this scenario. There were also numerous posters at the workshop. Several caught my eye, including one entitled “Improving Factor-Based Quantitative Investment by Forecasting Company Fundamentals” from John Alberg and Zachary C Lipton, as well as Time Series Forecasting via Matrix Estimation by Anish Agarwal, Muhammed Amjad, Devavrat Shah and Dennis Shen, which included a real world study on bitcoin price prediction.
The time series workshop was a very enjoyable day and I learnt a lot from it. Indeed, it’s hearing about people’s tips and tricks which can be most invaluable. Whilst most of the discussion did not centre around finance, I am sure a lot of what I heard about could be applicable for financial problems.