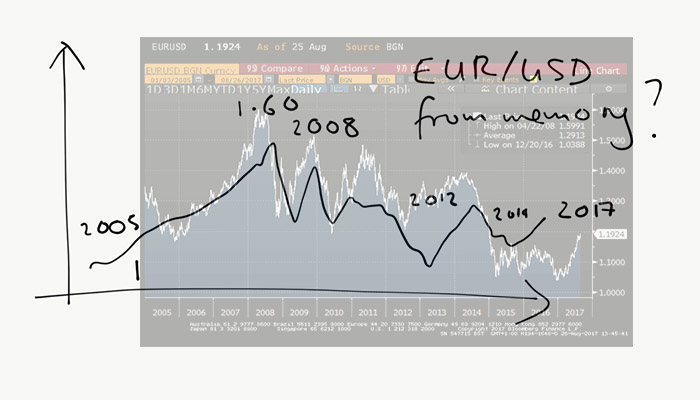
Over the years, you begin to build up a mental historical picture for price action. It seems reasonable to expect that we might remember certain market moves better than others and also what were the events which accompanied them. However, which ones do we remember? 2008.. let’s just say I remember the price action quite well then! What about the dollar rally in 2014, the fall in crude oil? As a bit of an exercise, I thought, why not draw EUR/USD spot over the past decade from memory. This would me to identify what I could recall and what I had forgotten about the price action. I could have chosen a couple of other currency pairs, but EUR/USD is probably the asset I follow most closely. During the course of the year, I probably check the price at least several thousand times, on my Bloomberg launchpad and plot the chart numerous times, so would hope that at least some of it would prove memorable. In the chart above, I’ve put my illustration of EUR/USD from memory. I’ve then superimposed it on the actual data EUR/USD from Bloomberg.
Obviously, I’ve done this after comparison after drawing my chart, otherwise the exercise is somewhat a waste of time. The first thing to note, is that I’m hopeless at drawing and given it’s been drawn freehand the scaling is haphazard, but let’s just look past that for a minute! I’ve got some points right. For example, I’ve managed to draw the all time high around 1.60. These very extreme points tend to sit well in memory, and I suspect in most folks minds. Also I’ve got some of the reversion in the price action in 2008/2009 period. I’ve been somewhat less successful at judging the price action in 2013. Also in recent years, the largely ranging period of 2015/2016, has been drawn as though it is shorter than it really was. If you do a similar freehand illustration of the asset you follow most closely what do you find (without specifically trying to learn the chart, which negates the whole exercise!)
Ok, this is admittedly, only a single illustration and I’d love to replicate such a study in a more statistical way with lots of market folks through a survey. However, there are several things that I take away from this (admittedly!) one data point. My memory is biased towards remembering big price moves. When price action is more ranging, I have more of a problem remembering these accurately, and I’ve underestimated the period where the price was ranging. Maybe this is not surprising that I can remember the big moves, but the “boring” ranging periods have somehow been expunged to some extent from my mind? We can sum up these observations, by noting that there is considerable bias in the way I view price action.
Why is this important? There is considerable value in combining our experience of price action over the years with quantitative analysis. Experience is valuable, and helps us come up with hypotheses, about what drives the market. However, at the same time, our observations are likely to display some element of bias, as I have suggested above. By checking our market hypothesis, we can hopefully remove some of the innate biases we have about the market. Obviously, this is not perfect, we can end introduce other biases, when we do quantitative analysis (excessive data mining), to try to “fit” a hypothesis. Our memory of how the market has changed is not perfect, but provided we are aware of its imperfections, it is an incredibly valuable asset when it comes to trading (that pun is very much intended!)