
Watching the price action during Thursday evening brought back memories of the Lehman bankruptcy. This was especially true when observing GBP. A move in any currency of 10% within a short period is highly unusual, with GBP/USD moving from a high of 1.50 to a low of 1.32. In a paper, by Iain Clark and myself, our model suggested the options market was pricing in a move of between 10-25% lower for GBP/USD in the event of the leave (free SSRN download of our paper), hence the actual move was just inside our predicted bounds. So while the spot market might have been complacent, the huge negative skew in the GBP/USD vol surface beforehand, suggested the options market was not quite so complacent. Elsewhere, equities were also hit and bonds have rallied on a safe haven bid. An immediate sell off in markets was to be expected on a leave vote.
How does this scenario compare with Lehman? The current situation is of course very different, the causes are not the same. Crises always are different, the template of the last crisis is often not the same as the next. However, one thing we should note is that bulk of a market sell off can happen in the shockwaves after an event, rather than purely on the initial shock. After all, following Lehman, the largest part of the sell off in markets occurred several weeks after the bankruptcy as noted by Bloomberg News’ Mark Cudmore in his brilliant article from Friday, entitled Don’t be a hero today (as an aside, if you have a Bloomberg terminal, I’d very much recommend subscribing to his daily macro note, which I read every day). Hence, we could be in store for more weakness in equity markets and poor risk sentiment in the coming weeks, which could also be good for safe haven assets like US Treasuries. One particularly important signal to watch would be if both GBP and Gilts begin to sell off at the same time, the types of dynamics you would associate more with an emerging market than any developed market. We have of course been there before, notably with EUR, which for a period traded with a risk premium associated with peripheral bonds.
The political question of what will happen to Britain and also the rest of the European Union is something which none of us can truly answer, even if there are several potential avenues that commentators have voiced. Senior politicians from the leave campaign appear to have disappeared, perhaps because they also have no plan? Will there be a snap general election? Who will be the next prime minister? Will there be a new leader in the Labour party? Will article 50 be triggered, and if so, when? Furthermore, it could take years for a final settlement with the EU, punctuated by negotiations and deadlines.
Perhaps the only thing we can agree upon is that there will be considerable uncertainty in the near term. Hence, market volatility is likely to be elevated with so many likely events on the horizon and I very much agree with Iain’s tweet below, that the market is probably misjudging longer dated vols. I suspect trading volatility markets will essentially become a game of guessing the timing of significant negotiation events and could wrongfoot many a market maker. In general, the environment should be good for market makers, with bumper trading volumes and heightened volatility.
1y GBPUSD vols at 12.5% look cheap, based on Catterall’s article. Back in 2008 they were 20%.
#brexit #article50 https://t.co/eJGoBbdE7g— Iain Clark (@IainJClarkQuant) June 24, 2016
What types of strategies could work in this type of environment? From a systematic perspective, it seems likely that trend following strategies would outperform now. Trend following strategies tend to have tail risk properties and do well during times of heightened market turbulence historically. There’s a great article written by the team at CFM entitled Tail Protection for Long Investors: Convexity at Work which discusses this in significant detail (free SSRN download of CFM’s paper). Notably, during 2008, CTAs generated significant positive returns in the face of a significant market sell off.
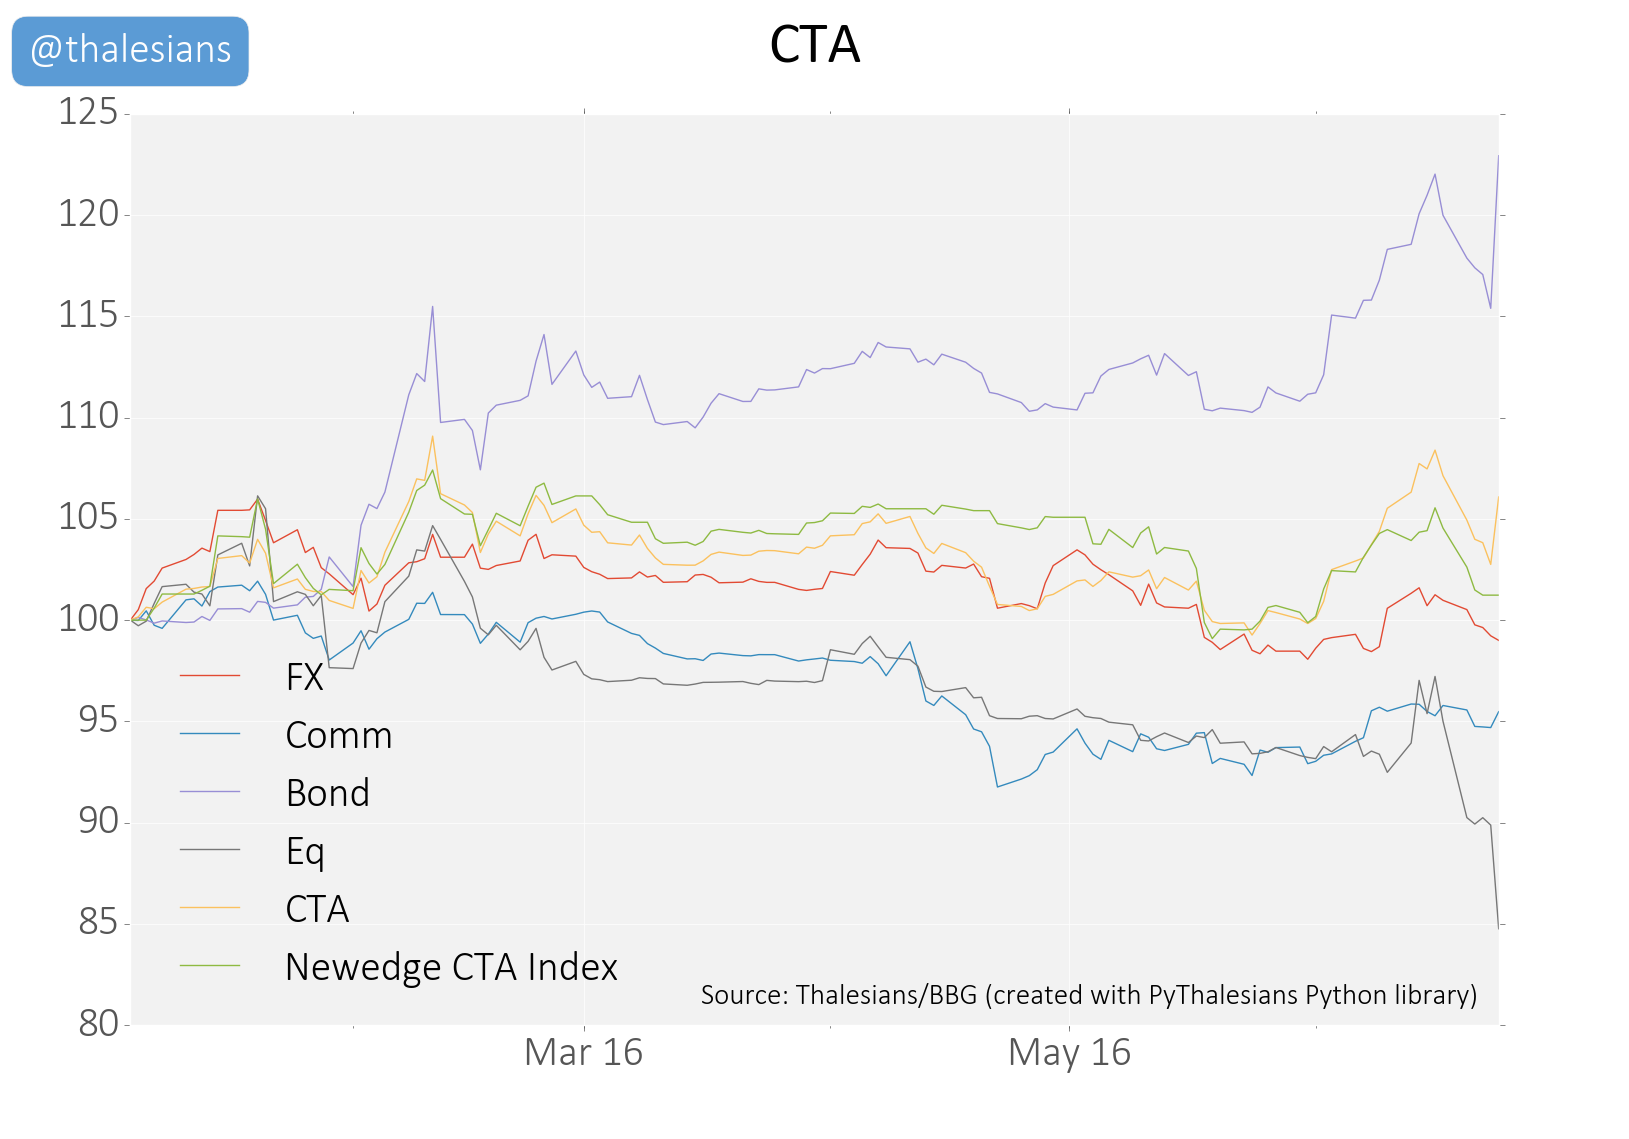
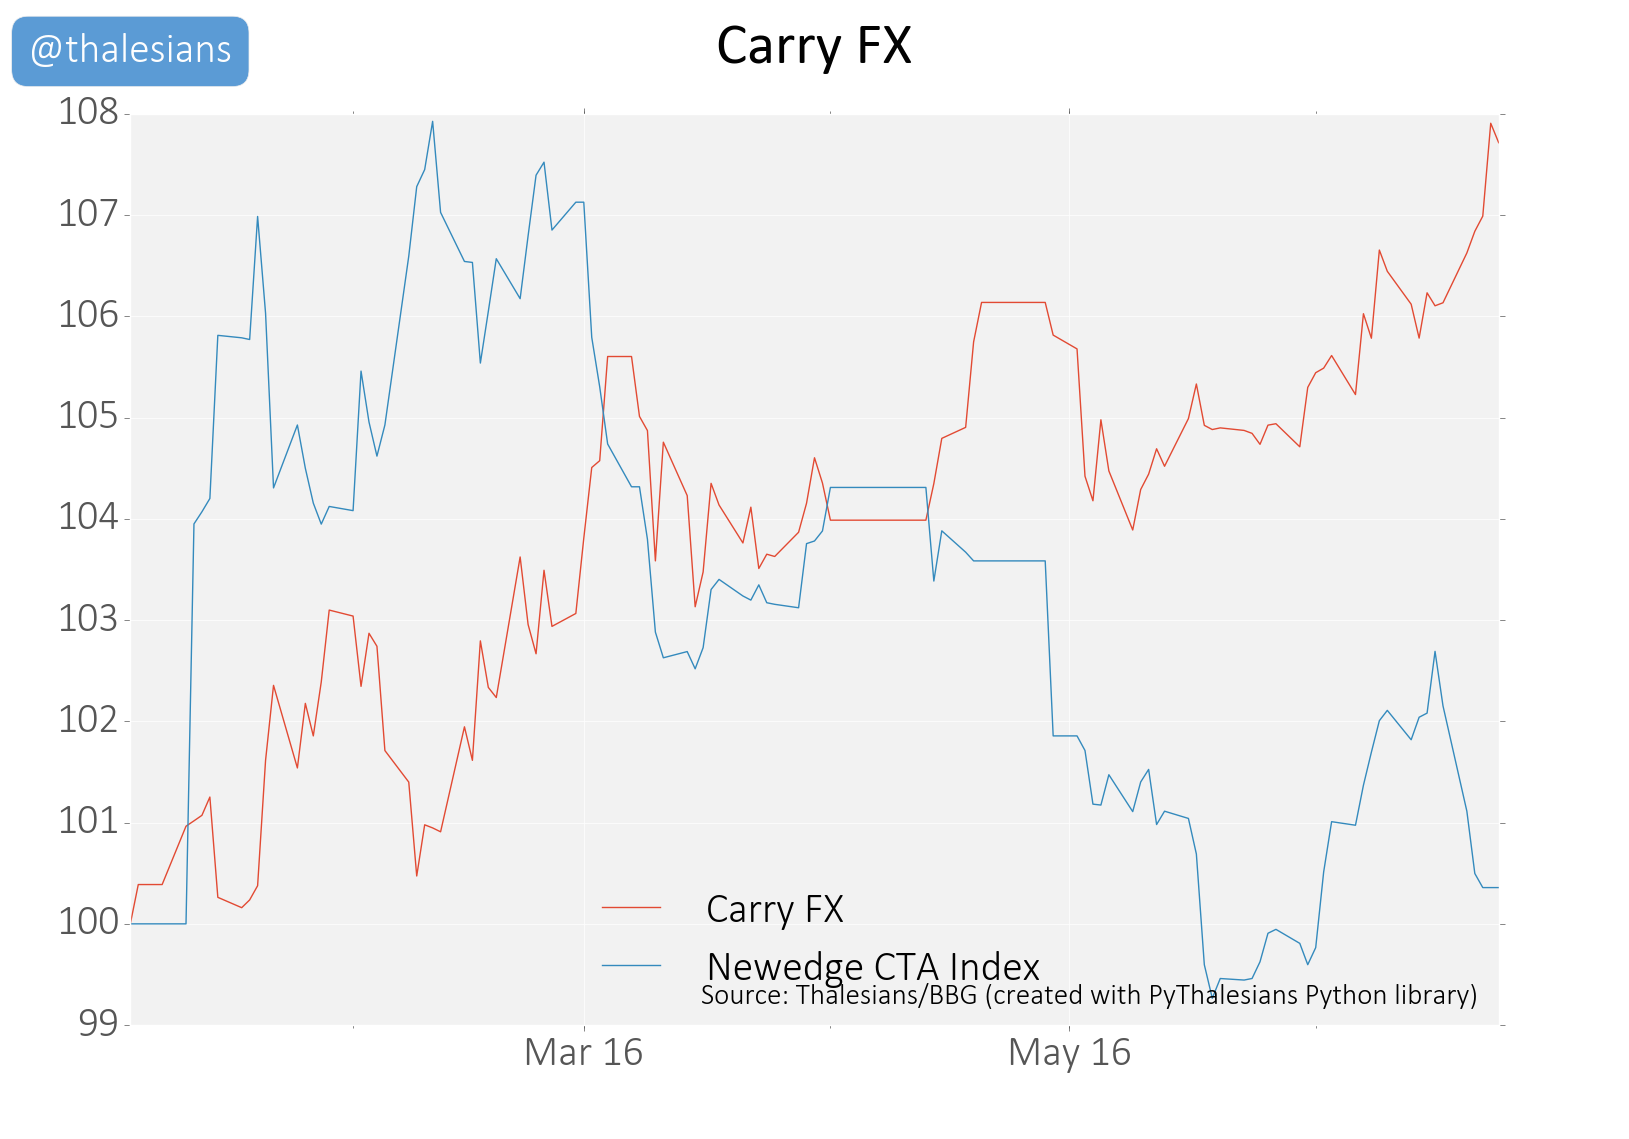
I’ve created my own multi-asset CTA proxy (below left), which tracks the Newedge CTA index. I’ve also included the returns for CTA style strategies which trade single asset classes. The Newedge CTA index is made of the actual returns of a few large CTAs, which suggests my index is a reasonable proxy of CTA fund returns. Note that the Newedge CTA index is lagged, so we haven’t yet got data for Friday yet. However, what we can see clearly from my index is that CTA’s did very well on Friday and this is consistent with recent news reports (see WSJ: Some Hedge Funds Clean Up After Brexit Vote). Using my proxy it looks as though CTA bond positions did very well, more than offsetting the losses from CTA’s equities exposure. By contrast, I suspect, in this type of environment of heightened volatility, we will likely see carry style FX strategies underperform (see below right), even if they do seem to have performed in the near term. Generally speaking, FX carry strategies underperform when market volatility is high.
The quant and trader for me is searching for trades in a scenario like this, however, the human in me, simply wants a solution to be found for this mess. I suspect much of the market will be feeling the same.
 |
 |